Launching and Working with Forecast Interactive Reports
This topic discusses how to:
Generate interactive reports.
Work with the Forecast Summary report.
Work with the Forecast Comparison interactive report.
|
Page Name |
Definition Name |
Usage |
|---|---|---|
|
RSF_FCAST_SAI |
Generate an interactive report summary of a revenue forecast or compare the current forecast to a previous forecast for the same time frame. |
|
|
By Business Unit Page |
RS_FCAST_BU |
Work with a forecast summary report by business unit. |
|
By Region Page |
RS_FCAST_RG |
Work with a forecast summary report by region |
|
By Sales Rep Page |
RS_FCAST_SR |
Work with a forecast summary report by sales representative. |
|
By Territory Page |
RS_FCAST_TR |
Work with a forecast summary report by territory. |
|
RSF_FCAST_COMP |
Work with the forecast comparison report. |
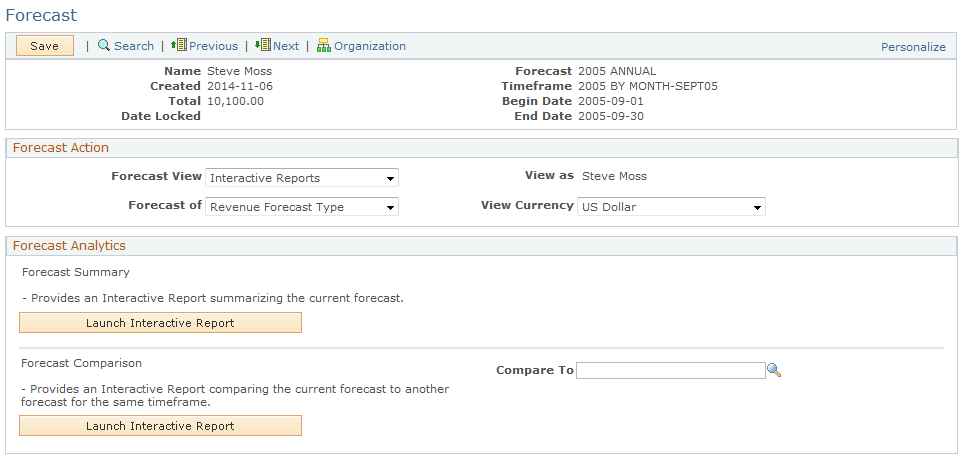
Use the Forecast (Interactive Reports view) page (RSF_FCAST_SAI) to generate an interactive report summary of a revenue forecast or compare the current forecast to a previous forecast for the same time frame.
Navigation:
Select Interactive Reports as the forecast view.
Select a Forecast of value.
This example illustrates the fields and controls on the Forecast page (Interactive Reports view).
Field or Control |
Description |
|---|---|
Forecast of |
Select Revenue or Shadow. |
Note: You can use interactive reports only if the functional option CORE_RSF_FCAST_SIMPLE is set to full functionality.
Use the Forecast Summary page (RS_FCAST_BU, RS_FCAST_RG, RS_FCAST_SR, and RS_FCAST_TR) to work with a forecast summary report by business unit, region, sales representative and territory.
Navigation:
Click the Launch Interactive Report button in the Forecast Summary group box on the Forecast (Interactive Reports view) page.
This example illustrates the fields and controls on the Forecast Summary - By Sales Rep. page.
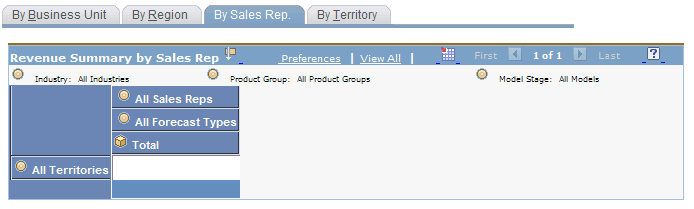
Select a dimension to view and analyze the forecast data from different perspectives. Within each dimension, you can organize the data by industry, model stage, or product group and drill down on various dimensions.
Field or Control |
Description |
|---|---|
Industry and Product Group |
The options for each of these fields are based on the industries and product groups. |
Model Stage |
Select the stage in the sales process for which you want to view data. |
Use the Forecast Comparison page (RSF_FCAST_COMP) to work with the forecast comparison report.
Navigation:
Click the Launch Interactive Report button in the Forecast Comparison group box on the Forecast (Interactive Reports view) page.
This summary compares the current forecast for a time frame with an earlier forecast for the same time frame.
Use these dimensions to rearrange the forecast comparison and analyze it from different perspectives:
Field or Control |
Description |
|---|---|
Show Deals |
Select the data to show in the comparison. Values are All Deals, Only revenue declines, Only revenue increases, Only fallout and Only new revenue. |
Product Group |
Select from product groups associated with the opportunities in the particular forecast. |