Personalizing Charts
This topic discusses how to personalize CRM chart pagelets.
|
Page Name |
Definition Name |
Usage |
|---|---|---|
|
RB_CHART_1, RB_CHART_2, RB_CHART_3 |
Select a chart and its display options. |
Use the Personalize Summary Chart page (RB_CHART_1, RB_CHART_2, RB_CHART_3) to select a chart and its display options.
Navigation:
Click the Customize button for the pagelet to be personalized (CRM charts 1 through 3).
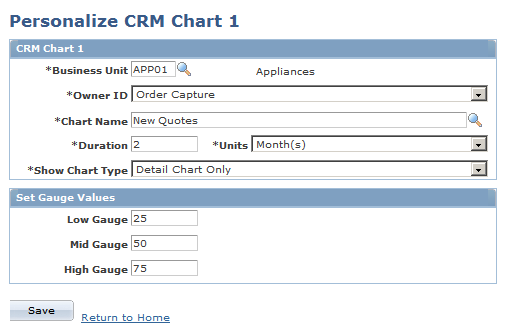
This example illustrates the fields and controls on the Personalize CRM Chart page.
Field or Control |
Description |
|---|---|
Business Unit |
Enter the business unit to be charted. |
Owner ID |
Select the owner of the chart. Values are: Call Center and Order Capture. |
Chart Name |
Select a chart associated with the selected owner ID. |
Duration and Units |
Select the number of days, hours, months, or weeks to be included in the chart data. You can show up to 24 hours, 7 days, 16 weeks, or 12 months of data. |
Show Chart Type |
Select a chart type. Values are: Detail Chart Only, Summary Chart Only, and Summary and Detail Chart. |
Low Gauge Value, Mid Gauge Value, andHigh Gauge Value |
Enter the top number for the low, middle, and high ranges in the gauge that appears in a summary chart. The gauge appears alongside the actual data. The gauge is strictly informational; it does not affect underlying data. Gauges appear only in summary charts; ignore these fields if the chart type is Detail Chart Only. |