Understanding Services Operational Dashboards
Services operational dashboards are collections of pagelets that are built to provide real-time actionable information for call center managers and agents, which help to increase agent efficiency, offer insight on customer needs and provide call center staff the tools needed to better serve the customer base. PeopleSoft CRM delivers two role-specific dashboards for call centers:
Manager Dashboard
Agent Dashboard
Each dashboard consists of pagelets that display call center data relevant to users of that role. Within pagelets, managers and agents can interact with data that is presented in charts and grids by drilling into bars and clicking links, which give them additional information about cases and solutions, as well as better insight on customers that require immediate actions.
Delivered pagelets are WSRP (web services for remote portlets) compliant so they can be used in any WSRP-compliant portal (for example, Applications Portal) or any other compliant external portal. They can be rearranged freely on dashboards by dragging and dropping by their titles to the desired areas, or by clicking the Layout link on the PIA homepage to personalize the dashboard's layout. In addition to the Manager and Agent Dashboards, these pagelets can also appear on the PIA homepage through configuration on the Personalize Content page (PORTAL_HPCOMP).
See PeopleTools: Applications User's Guide, Setting User Preferences, Personalizing Layout.
The Manager Dashboard displays operational data for cases that are assigned to provider groups and these provider groups are associated with the manager that is selected in pagelet personalization pages of the logged on user. The manager-provider group relationship is established on the Provider Groups page.
The Manager Dashboard includes these pagelets out of the box:
Cases at Risk of Exceeding SLA (service level agreement)
Manager Case Backlog
Case Arrivals versus Closures
Top Solutions by Product
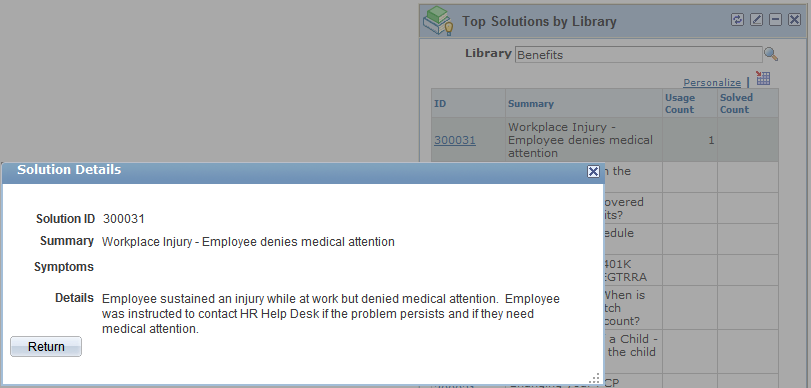
Top Solutions by Library
Top Solutions by Category
PeopleSoft CRM Manager Dashboard
See Working with the Manager Dashboard for more information on dashboard pagelets.
The Agent Dashboard displays information of all open cases that are assigned to the logged on agent. It includes these pagelets out of the box:
My Case Backlog
My Open Case SLA Status
Agent - My Cases
Top Solutions by Product
Top Solutions by Library
Top Solutions by Category
PeopleSoft CRM Agent Dashboard
See Working with the Agent Dashboard for more information on dashboard pagelets.
Several delivered pagelets represent case information in the form of stacked bar charts. These charts are interactive. When you put your mouse over a bar, hover text appears, showing the number of cases with the status or priority that the bar represents. When you click a bar, a modal secondary page is displayed:
This example illustrates the fields and controls on the Modal secondary page appears with a list of cases after clicking a bar on a stacked bar chart.
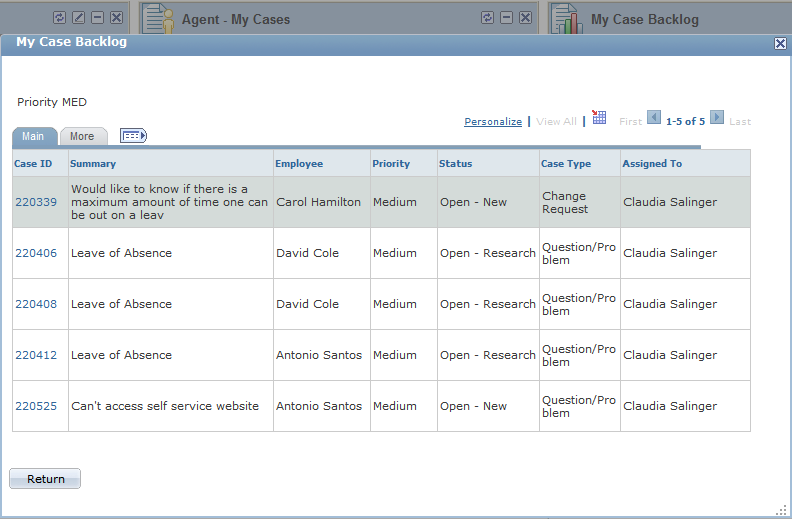
The page lists the summary information of the cases that the bar represents. Clicking a case ID link transfers you to the Case component on a new browser window where you can update the case.
Solutions-specific pagelets are built in the form of grids. Each grid displays the top ten solutions with the highest solved counts and usage counts. It shows basic information such as solution summary, usage counts and the number of times they are used to solve cases. For each solution-specific pagelet, you can change the criterion (product, solution library, and category) by which the solution information is filtered. You can also click a solution ID link to transfer to a modal secondary page and view the solution in more detail:
This example illustrates the fields and controls on the Modal secondary page appears with solution detail after clicking a solution ID link.
Important! Make sure to run the Update Solution Usage Counts process that updates solution usage and solved count, so that solutions can be ranked and displayed properly on pagelets.