 Dashboards
This chapter discusses:
Dashboards.
Dashboard data.
Dashboard elements and the dashboard interface.
DashboardsOperational dashboards present real-time information about business operations and enable users to take appropriate actions based on that information.
The information appears in interactive graphical reports that enable business users to quickly understand the health of their operations at a summary level and to drill into more detailed information. Targets and thresholds are integrated into the reports to help users readily identify business risks, and system-generated alerts notify users when predefined conditions are met.
The data that appears in the dashboard originates in one or more transactional systems. An efficient messaging system ensures that data changes in the transactional systems are sent immediately to the dashboard system and that dashboard reports are updated in near real time.
Messages are also sent the other direction: when a dashboard user initiates an action, the dashboard system sends the action request back to the transactional system where the action is completed—at which point, any data changes that are the result of the action are immediately sent back to the dashboard system where the user can see the results of the actions.
Dashboard DataThe transactional system sends two types of data to the dashboard system. Facts are the data objects on which you report—the actual transactions that the business is monitoring. For example, in the PeopleSoft CRM dashboard applications, cases, orders, leads, and opportunities are all facts. Dimensions are lookup tables with values that are referenced in fact tables or in other dimensions. For example, a case fact might reference dimension tables with status values, and the case, order, lead, and opportunity facts might all reference a common dimension table with customer data.
Although the fact and dimension data originates in the transactional system, there are two types of data that are maintained directly in the dashboard system:
Certain targets and thresholds.
Certain dashboard reports show status against defined targets and thresholds. Although some targets (such as sales forecasts) can be derived from the transactional system, other targets are meaningful only in the context of the dashboard report and are therefore maintained in the dashboard system. Each dashboard application has its own user-facing dashboard pages for setting targets and thresholds.
The dashboard system generates the alerts and stores the conditional logic that determines when alerts are triggered. Use the Oracle BAM tools to maintain alert conditions.
Dashboard Elements and the Dashboard Interface
PeopleSoft dashboard applications use a standard interface that guides users from high-level summary information into deeper detail and, if necessary, into actions that the user can take in response to the information that is shown.
This section discusses:
The dashboard window.
Summary reports.
Discovery reports.
Actions.
Alerts.
 The Dashboard Window
Although dashboard users access the dashboard system from the PeopleSoft menu, the dashboard itself appears in a separate window.
The main dashboard window has application-specific pages for each licensed dashboard application and an application-independent page for viewing alerts:
Main dashboard window
The content of a page in the dashboard window is called a report. From the main dashboard window, users can access additional reports that appear in new windows.
Note. These new windows do not provide the ability to navigate back to the main dashboard window. To reopen the main dashboard window after closing it, users must return to the PeopleSoft system to click the My Dashboards menu link. Users should generally leave the main dashboard window open for their entire dashboard session.
Reports contain elements known as views. Views can be charts or other graphical elements (for example, pie charts, bar charts, or gauges), or they can be text data in a structured format such as a grid.
Refer to the dashboard application documentation for information about specific dashboard reports.
Note. The end-user interface does not have a page for setting up alerts. To define alerts, use Active Studio, the report- and alert-building tool within Oracle Business Activity Monitoring (BAM).
These toolbar buttons appear at the top of the main dashboard window. They are visible only if the user is authorized to perform the underlying function.
|
Click to send a copy of the current report—with the current report data—to other dashboard users. The dialog box that appears includes fields for selecting recipients and adding subject and message text to accompany the emailed report. Note. PeopleSoft CRM dashboard applications include an additional email interface for sending template-based email from a transaction to people such as customers who are related to the transaction. Refer to your the documentation for CRM dashboard applications for more information. |
|
|
Click to print just the current report without additional window elements such as the toolbar button or the tabs for each of the dashboard pages. In the print preview window that appears, click the Print button to complete the print request or the Close button to close the window without printing. |
|
|
Click to open Oracle BAM Active Studio, the application for creating and modifying dashboard reports. Dashboards and Tab Groups are specific elements in Active Studio and clicking the corresponding buttons opens those elements. The Edit Content button opens the current report in Active Studio. |
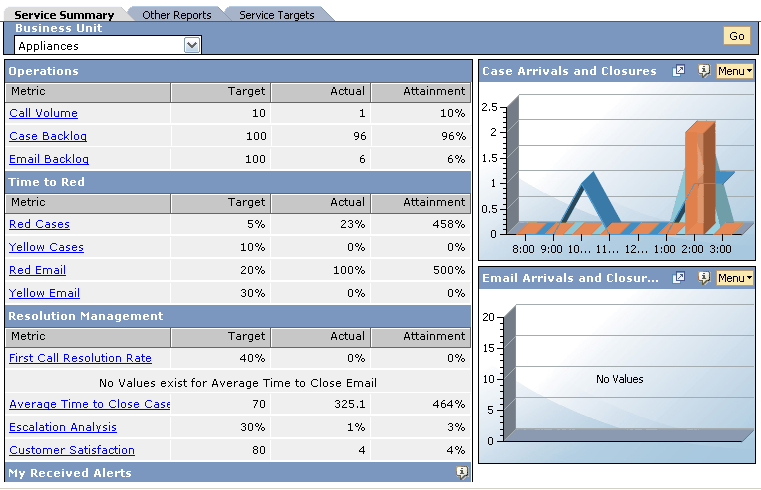
Summary ReportsIn the main dashboard window, there is a summary report for each dashboard applications. Summary reports include these views:
One or more global filters that restrict the data that is included in the summary.
For example, in PeopleSoft Sales, the global filter limits the report to a single region. The default value comes from the user preferences in the PeopleSoft system, but the user can select a different business unit from the drop-down list box on the report and then click the Go button to apply the new filter.
Summary metrics for each of the application's major themes.
For example, Forecast Management is one of the themes in PeopleSoft Sales, and the summary report for the PeopleSoft Sales dashboard shows various metrics related to this theme.
The summary metrics show targets, actuals, and the actual as a percent of the target. Depending on the specific metric, it might be better for this percentage, called Attainment, to be high or low. For example, a case backlog over 100% means you have more cases than your target, which is undesirable. On the other hand, a first call resolution rate over 100% means you are closing more cases on first contact than your target, which is a desirable thing. Users should consider each metric's actual meaning to determine whether the attainment levels are good or bad.
Graphical views that illustrate key business operations.
For example, the summary report for the PeopleSoft Sales dashboard includes bar charts that show the actual and forecasted revenue for each sales person.
Alerts appear both in the alerts view on the summary report and on the separate full-page Alerts report. Although the contents of the small view and the full-page report are the same, the full-page report enables users to see more information at once.
This is an example of a summary report:
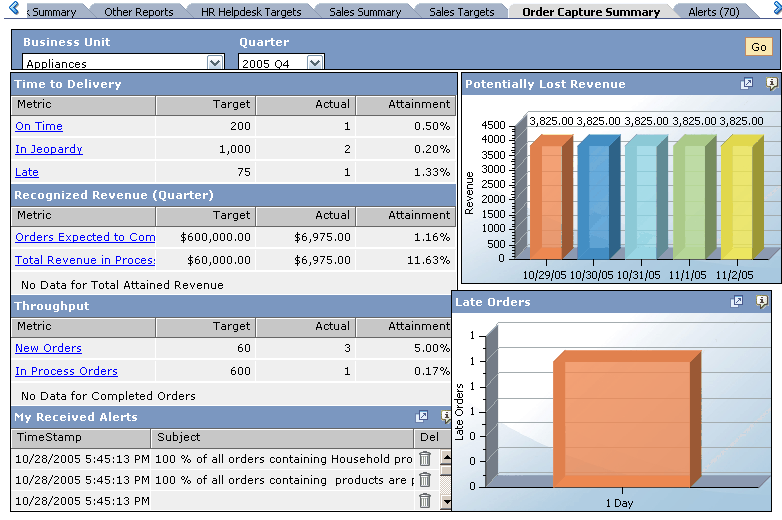
Order Capture Summary report
Discovery ReportsUsers drill into the summary metrics or the graphical views on a summary report to access discovery reports that provide additional related data. A new Oracle BAM Active Viewer window opens when a user accesses a discovery report. Typically, the metric that the user is exploring is repeated across the top of the discovery report.
This example of a discovery report from the PeopleSoft Services Dashboard application has four views that show different information related to the case backlog metric from the Services Summary report:
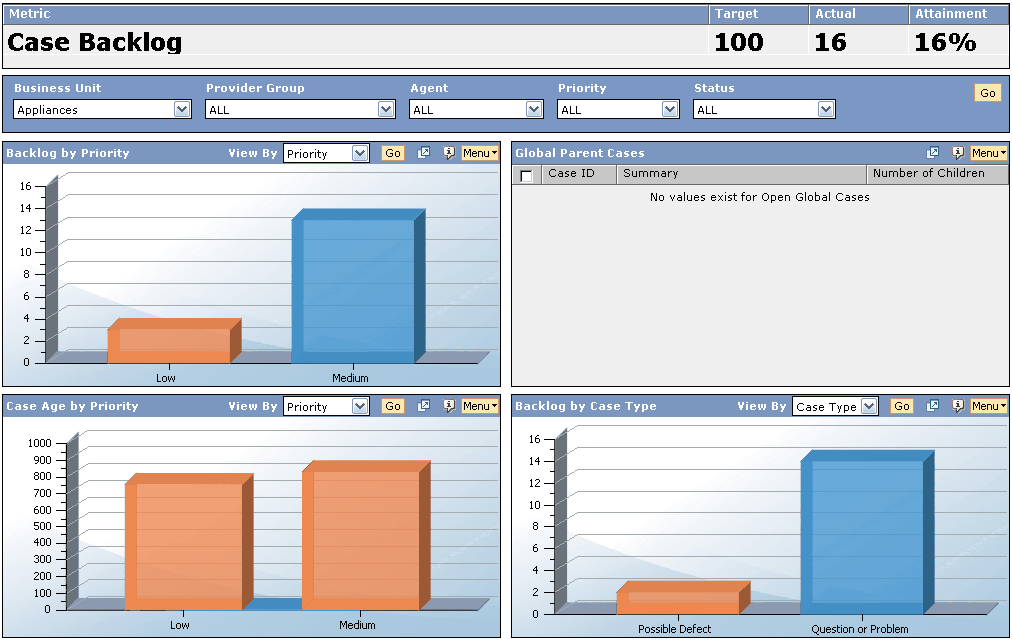
Discovery report
Discovery reports include views that expand on the data from which the user accessed the report. For example, the Services Summary report has a case backlog metric. The related discovery page shown here repeats the main metric and provides four additional views that help the user analyze the nature of the cases in the backlog.
Dashboard users have a variety of page controls that are available to help manipulate the views on a report:
|
Global filter fields for filtering report data appear at the top of the report. Users select filter values from drop-down list boxes, then click the Go button to apply the filter. The filter applies to every view in the report. The specific filter fields on a report depend on the type of data that is shown. |
|
|
The View By drop-down list box on individual views provides instant multidimensional reporting. For example, a bar chart that initially shows case arrivals by priority can be instantly changed to show case arrivals by severity. Users select a view by value and then click the Go button to update the display. |
|
|
Click the Zoom icon to open a new window with a larger version of the view. Zooming is particularly useful when a chart has so many categories that the label text is hard to read in the report or when you want to see more data in a single view in a grid. |
|
|
Click the Information icon to see a description of the view. |
|
|
Menu |
Click the Menu button to access a pop-up menu with report navigation links and links to context-appropriate actions. |
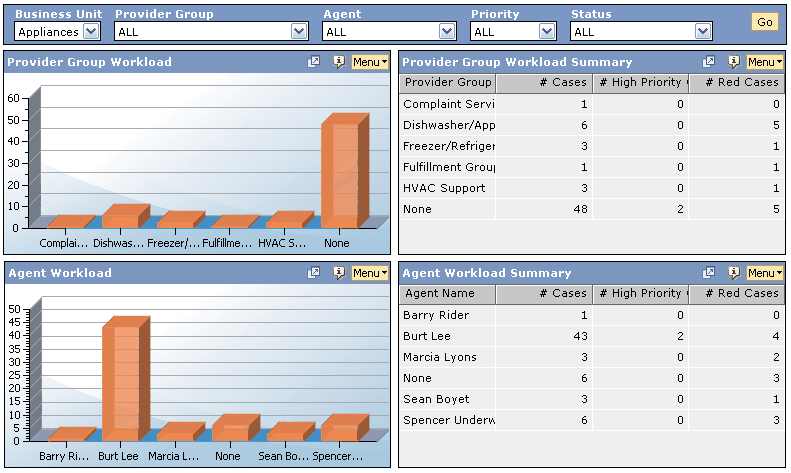
The views on a discovery page have predefined drilling hierarchies that enable users to access increasing levels of detail. The lowest level of any hierarchy is a list of individual transactions.
Because drilling hierarchies are predefined, users may lose the ability to drill down after changing the value in the View By field. For example, the default View By value for the Backlog by Priority view is Priority, and the predefined hierarchy is Priority-Status-Detail List. If a user at the top level of the hierarchy changes the View By value to Severity then the only drilldown that is available is directly to a list of individual transactions.
|
|
When you place the cursor over a view element and the cursor becomes a magnifying glass, you can click your mouse to drill into the element. When drilling into charts, the dashboard displays the chosen subset of data in a new chart. For example, if a user clicks the bar for Medium priority cases in the Backlog by Priority chart, the view changes to a bar chart that shows the medium priority cases by status. Typically, the delivered charts have up to three levels of predefined drilling hierarchy; the third (lowest) level is the list of individual transactions. When drilling into an individual transaction, the dashboard opens a new PeopleSoft window that shows the transaction in the PeopleSoft system. This new window is a standard PeopleSoft window, not a dashboard window. |
Clicking the Menu button on a view or right-clicking within the view displays context-appropriate options:
Menu contents
The right-click menu has all of the same commands as the menu button. However, if the cursor is directly over a chart element (such as a bar in a bar chart), additional drilling commands are available from the right-click menu.
|
<Drill-down and navigation links> |
The hierarchical links at the top of the menu enable users to drill down into the view data according to a predefined hierarchy. For example, if a view shows cases by priority and then by status, a user who is looking at cases by priority can drill down to see cases of a specified priority broken down by status. The Home and Drill Up links do not appear when the user is at the top level of the predefined hierarchy. However, once the user drills down to a lower level of the hierarchy, the Home link returns the user to the top level of the hierarchy, while the Drill Up links take the user one step up in the view hierarchy. The Show Details link appears only when the user right-clicks over a specific chart element such as a bar on a bar chart. Click this link to access a list of the individual transactions for the chart element. |
|
<Action links> |
The links under the Actions heading open action forms. If the user accesses the menu from the menu button or by right-clicking the chart background, the action form lists all transactions that were included in the view at the time the action form was accessed. If the user accesses the menu by right-clicking a specific chart element (for example, the bar for medium priority cases), then only the transactions that are represented by that chart element are included in the action form. |
ActionsActions are the “operations” in operational dashboards. When the reports and alerts bring an issue to a user's attention, actions enable the user to react to the issue appropriately without ever leaving the dashboard system.
This example of an action form from the PeopleSoft Service Dashboard enables users to reassign cases:
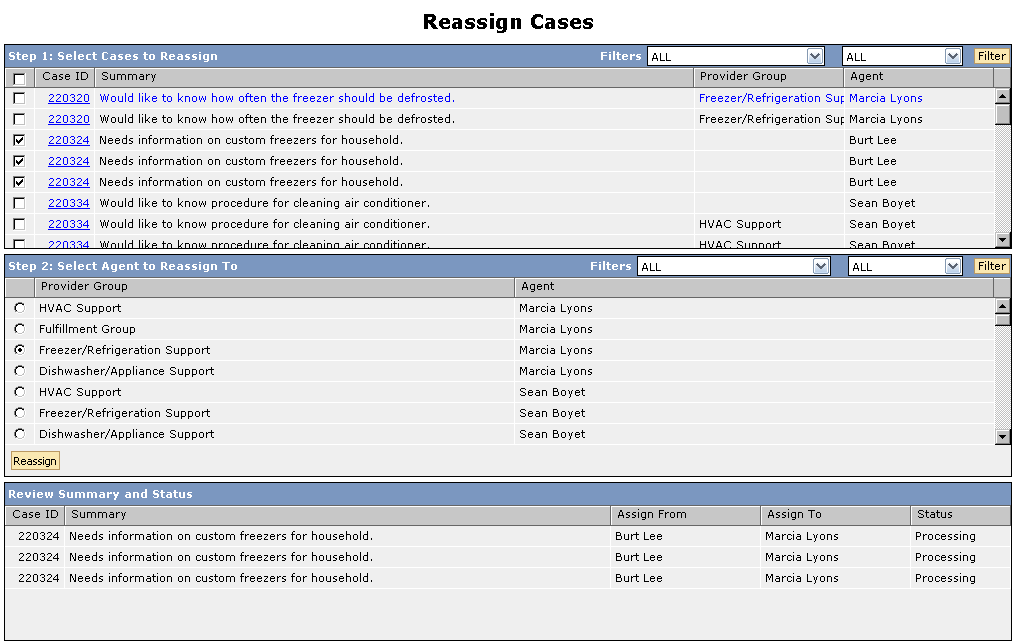
Action form
Important! Although the three-part format of this action form is typical, other action forms vary in ways that are appropriate for the specific action that is being performed. Refer to your dashboard application documentation for information about specific action forms.
The first step in an action form is to select the transactions to be included. Even before accessing the action form, users can leverage the filtering and drilling capabilities of dashboard reports and views to define a set of transactions upon which to act. Then, when the user selects an action, the system preserves the current data selection and presents an action form that lists the selected transactions.
Selecting a subset of transactions enables the user to vary the action parameters for different transactions. For example, if a call center manager has a list of 100 cases to reassign, the manager can select 10 to assign to user A, another 10 to assign to user B, and so forth.
Filters enable criteria-based selection. Applying a filter changes the content of the transaction list and is a practical way to make a long list more manageable. For example, a call center manager who needs to reassign all cases that are currently assigned to an employee who is on leave can filter by agent to see the relevant cases.
After filters have been applied, or when filter-based selection is not desirable, a check box column in the list of transactions enables manual selection of individual transactions.
Note. In the list of transactions, the first column includes links that a user can click to access the transaction in the PeopleSoft system.
Entering Action Parameters and Submitting an Action
Some, but not all, actions require parameters. For example, to reassign cases, a user needs to specify the new provider group and agent. Page elements for setting these parameters appear below the transaction list. When setting parameters involves selecting existing values (rather than freeform data entry), the action form provides a list of possible values. If multiple parameters are possible (for example, selecting a provider group and an agent), each valid combination of parameters is listed separately.
Filter fields at the top of the section help the user work with the list.
After the user selects or enters the necessary parameters, clicking the action button submits the action. The label on the action button depends on the action being performed: it is labeled Reassign in the Reassign Cases action form.
Users can perform the same action several times without leaving the action form. For example, the user can submit ten cases to be reassigned to provider group A, then change the transaction selection and the parameters to reassign ten different cases to provider group B.
Each time a user clicks the action button, the dashboard system sends a message to the PeopleSoft system with all the data that is necessary for completing the action: the action ID as well as the transaction list and the parameters. At the same time, the Review Summary and Status area of the action form displays a list of the transactions to be acted on and the details of the action.
The Status column in this grid indicates how far along the action processing is. The initial status is Processing. Because the PeopleSoft system sends confirmation information for each transaction, the status will eventually be either Complete or Error. The amount of time it takes to process the action depends on, among other things, the number of transactions that are submitted as part of the action request.
The Review Summary and Status list is session-specific. This means that a dashboard user who closes the action form no longer has access to the list. Reopening the action form starts a new session, and the Review Summary and Status list is empty until an action is submitted during the new session.
Although a user can no longer see the list of submitted transactions after closing the action form, the requested actions are still performed. The system sends alerts if any of the actions fail
See Setting Up Dashboard Actions.
AlertsAlerts are messages that the dashboard system sends to specific users when predefined conditions are met. The dashboard interface includes a (full-page) Alerts report and a small Alerts view on each of the application summary reports.
The report and the view display the same alerts, but the report shows more alerts at a time and additional details about the selected alert:
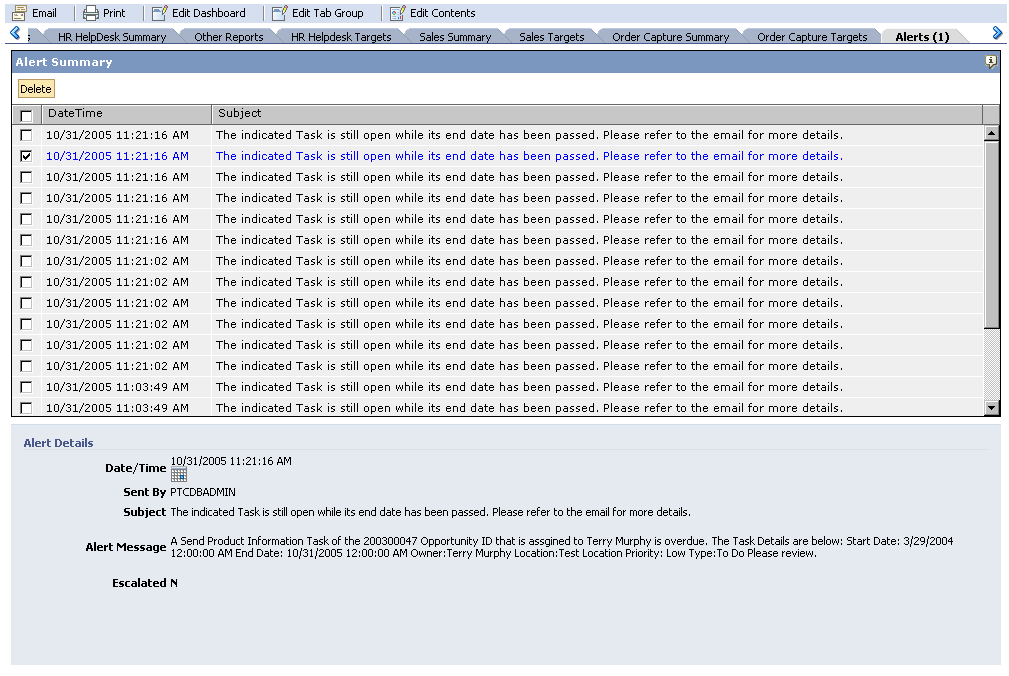
Alert report
Alerts are automatically generated when specified conditions are met. Alerts do not necessarily demand action—they simply notify the user of a situation. It is then up to the user to respond appropriately.
Depending on how the alert is defined, the system might resend the alert at defined intervals as long as the condition is true. The system does not, however, remove alerts when the conditions are no longer true. For example, if a call center manager receives an alert when 10 percent of open cases are late, the alert does not disappear if the percentage later drops. The manager needs to manually delete the alert to remove it from the list.
Organizations normally have unique requirements for alerts. To meet these requirements, you can create and maintain your own alerts following the instructions provided in the Oracle BAM documentation.
PeopleSoft delivers representative alerts that you can use as models. You can also use the delivered alerts as-is, but because the alerts are associated with specific users, they are not automatically active. The installation documentation for the dashboard applications includes instructions for associating the delivered alerts with your users.
See PeopleSoft Enterprise Customer Relationship Management 9 Supplemental Installation Guide.